
Journal of Earth Sciences, Geology and Geospatial Research (Annual (One issue per year))

ABSTRACT
El Niño–Southern Oscillation (ENSO) remains the dominant source of interannual climate variability affecting the Indian subcontinent, yet its statistical relationship with the Indian Summer Monsoon Rainfall (ISMR) has weakened markedly since the 1980s, even as the frequency and severity of associated extreme weather events heatwaves, deficit and erratic monsoons, and compound flood-drought sequences has intensified. This paper presents a systematic, PRISMA 2020-guided review and structured narrative meta-analysis of 27 peer-reviewed and institutional studies published between 2010 and 2026 to (i) characterise present-day trends linking El Niño phases to extreme weather across India, (ii) critically appraise the quality, confidence levels, and data gaps of the existing evidence base, and (iii) project future climate risk under CMIP6 Shared Socioeconomic Pathway (SSP) scenarios. Findings indicate a robust post-El Niño heat-extreme amplification, reported in all reviewed heat-extreme studies; a regionally heterogeneous and weakening core-zone monsoon teleconnection, reported in the majority of monsoon studies; and consistent agricultural yield penalties of 3–20% for rice, maize, pulses, and groundnut during El Niño years. The year 2024 - the warmest on record for India since 1901 - is used as an illustrative present-day case, during which heatwave conditions were recorded on 54 of 92 pre-monsoon days and more than 3,000 deaths were attributed to combined extreme-weather events nationally. The review concludes with six ranked, policy-relevant recommendations spanning early-warning systems, heat-health governance, agricultural risk transfer, and long-term adaptation financing, intended to support government planning under conditions of rising climate risk and weakening seasonal predictability.
Keywords: El Niño-Southern Oscillation; Indian Summer Monsoon; Heatwaves; Climate Extremes; CMIP6 Projections; Climate Risk; India; Agricultural Drought; Systematic Review; Meta-Analysis; PRISMA 2020
INTRODUCTION
Research Background and Significance
India’s climate system is governed by the southwest monsoon, a seasonal circulation that delivers roughly 70% of the country’s annual rainfall between June and September and underpins the livelihoods of more than half a billion agriculturally dependent people [1]. Superimposed on this seasonal rhythm is the El Niño–Southern Oscillation (ENSO), a coupled ocean–atmosphere phenomenon originating in the tropical Pacific that has historically been the single most important predictor of year-to-year monsoon performance. During the warm (El Niño) phase, anomalous warming of the central and eastern equatorial Pacific weakens the Walker circulation and has, in many historical years, suppressed monsoon rainfall over the Indian core zone while simultaneously priming the subcontinent for post-monsoon and pre-monsoon heat extremes [2].
The years 2023 and 2024 provided a stark illustration of this risk. A moderate-to-strong El Niño developed through the second half of 2023 and decayed across the 2024 pre-monsoon season, coinciding with India’s warmest year since national records began in 1901 [3]. Multiple northwestern stations approached 50°C; heatwave conditions were declared on 54 of the 92 days of the pre-monsoon season; and more than 3,000 deaths along with 3.2 million hectares of damaged cropland were attributed to the year’s extreme-weather sequence as a whole [3-4]. These outcomes were not an isolated anomaly but the latest expression of a longer-term pattern in which El Niño years have repeatedly coincided with drought, heat stress, and agricultural shortfall across India - a pattern that is itself being reshaped by anthropogenic warming.
Critically, the conventional understanding that El Niño years are reliably associated with weak Indian monsoons is itself undergoing revision. Multi-decadal analyses show that the inverse ENSO–ISMR relationship, which was strong and stable through most of the twentieth century, has weakened substantially over the central “core monsoon zone” since the 1980s, even as it has remained stable in the south and intensified in parts of the north [1-2]. At the same time, independent observational work suggests that El Niño years are now associated with a different and arguably more dangerous signature: an increase in short-duration extreme daily rainfall over central India, even when seasonal totals are close to normal, alongside a contrasting decrease in extreme rainfall likelihood over the southeast and northwest [5]. This combination weakening seasonal predictability paired with intensifying extremes creates a present-day policy challenge that is fundamentally different from the one Indian disaster management institutions were originally designed around, and it forms the central motivation for this review.
Definition of Key Concepts
- El Niño–Southern Oscillation (ENSO): A naturally occurring, irregular (2–7 year) oscillation in sea surface temperature (SST) and atmospheric pressure across the tropical Pacific, comprising a warm phase (El Niño), a cold phase (La Niña), and a neutral phase, conventionally tracked using indices such as the Oceanic Niño Index (ONI) and Niño 3.4 SST anomalies.
- Indian Summer Monsoon Rainfall (ISMR): The June–September rainfall total over the Indian landmass, expressed as a percentage departure from the long-period average (LPA), and used by the India Meteorological Department (IMD) as the principal national rainfall metric.
- Teleconnection: A statistical and dynamical linkage between climate anomalies in geographically distant regions; here, specifically the ENSO–ISMR relationship and its observed weakening over recent decades.
- Extreme weather event: A meteorological occurrence heatwave, heavy rainfall day, cyclone, flood, or agricultural drought that falls in the tail of the local historical distribution and is associated with quantifiable human, economic, or ecological impact.
- Compound hazard: The co-occurrence or close succession of two or more extreme events for example, drought followed by heatwave, or deficit monsoon followed by post-monsoon flooding whose combined impact exceeds the sum of the individual hazards.
- Shared Socioeconomic Pathway (SSP): A CMIP6 scenario framework describing alternative trajectories of greenhouse gas emissions and socioeconomic development, used in this review (SSP1-2.6 through SSP5-8.5) to bound future climate risk for India.
Research Questions and Objectives
This review addresses four interlinked research questions, each mapped to a specific objective of the synthesis that follows:
RQ1: What is the current strength, direction, and regional structure of the ENSO–ISMR teleconnection, and how has it changed over the observational record? (Objective: quantify and map present-day teleconnection trends.)
RQ2: How are El Niño phases statistically associated with heatwave frequency, intensity, and mortality across India? (Objective: synthesise effect sizes and confidence levels across heat-extreme studies.)
RQ3: What is the documented impact of El Niño-linked climate variability on Indian agricultural production and food security? (Objective: aggregate yield-impact estimates across major kharif and rabi crops.)
RQ4: Under CMIP6 SSP scenarios, how is El Niño-related climate risk over India projected to evolve through the twenty-first century, and what are the corresponding implications for adaptation policy? (Objective: translate climate-model evidence into ranked, actionable policy recommendations.)
MATERIALS AND METHODS
Search Strategy and Databases
A systematic literature search was conducted independently across eight electronic databases and five institutional or governmental repositories. All database searches were executed between 14 January 2026 and 8 March 2026. Institutional and government report sources were accessed and harvested between 1 February 2026 and 15 April 2026. Table 1 lists each source, the tailored search string applied, and the initial record count obtained. Full Boolean search strings for each database, including field tags, proximity operators, and filter specifications, are reproduced in Supplementary Table S1 at the end of this manuscript.
The general search logic combined three concept blocks joined by AND: (i) the climate driver ("El Niño" OR "ENSO" OR "El Niño" OR "Southern Oscillation" OR "ENSO event"), (ii) the geographic focus ("India" OR "Indian subcontinent" OR "South Asia"), and (iii) the outcome domain ("monsoon" OR "Indian Summer Monsoon" OR "ISMR" OR "heatwave" OR "heat wave" OR "drought" OR "extreme rainfall" OR "flood" OR "cyclone" OR "agriculture" OR "crop yield" OR "food security" OR "climate projection" OR "CMIP6" OR "SSP scenario"). Filters applied consistently across peer-reviewed databases: publication year 2010–2026; English language; all document types (journal articles, conference papers, reviews). Grey literature sources were searched without language restriction. The search was not registered on PROSPERO because systematic review registration for climate-science evidence syntheses is not yet standard practice; however, search dates and strings are fully documented here and in Supplementary Table S1 in the interest of reproducibility.
|
Source / Database |
Tailored Search String (Abbreviated — see Suppl. Table S1 for full string) |
Search Date |
Initial Records (n) |
|
Scopus |
("El Niño" OR "ENSO") AND "India" AND ("monsoon" OR "heatwave" OR "drought" OR "extreme rainfall" OR "flood" OR "CMIP6") |
14-Jan-26 |
138 |
|
Web of Science (Core Collection) |
TS=("El Niño" OR "ENSO") AND TS=(India) AND TS=(monsoon OR heatwave OR drought OR "extreme rainfall" OR flood OR "climate projection") |
14-Jan-26 |
97 |
|
ScienceDirect |
"El Niño" OR "ENSO" AND India AND (monsoon OR heatwave OR drought OR flood OR agriculture) |
20-Jan-26 |
61 |
|
SpringerLink |
(El Niño OR ENSO) AND India AND (monsoon OR heatwave OR drought OR CMIP6) |
20-Jan-26 |
44 |
|
Wiley Online Library |
("El Niño" OR ENSO) AND India AND (monsoon OR drought OR heatwave OR flood OR "climate change") |
22-Jan-26 |
29 |
|
Nature Portfolio (nature.com) |
"El Niño" OR ENSO AND India AND (monsoon OR heatwave OR extreme weather) |
22-Jan-26 |
18 |
|
arXiv (climate physics; atm-clim) |
El Niño India monsoon heatwave drought |
1-Feb-26 |
14 |
|
Research Square (preprints) |
El Niño ENSO India monsoon climate extremes |
1-Feb-26 |
11 |
|
IMD / NCMRWF Technical Reports |
Manual harvest of annual climate summaries and seasonal outlook reports |
1 Feb–15 Apr 2026 |
9 reports |
|
NDMA / NCRB Annual Reports |
Manual harvest of heat-related mortality and disaster reports |
1 Feb–15 Apr 2026 |
8 reports |
|
FAO Agricultural Outlook documents |
Manual harvest of El Niño agricultural risk and district risk-mapping documents |
1 Mar–15 Apr 2026 |
7 documents |
|
IPCC AR6 Working Group I |
Chapters 4, 8, 11, 12; Atlas: South Asia |
1-Feb-26 |
1 report |
|
Google Scholar (supplementary sweep) |
"El Niño" India monsoon heatwave CMIP6; first 5 pages only, to capture recent high-citation studies not indexed in primary databases] |
8-Mar-26 |
~75 screened |
Table 1: Database Sources, Tailored Search Strings (Abbreviated), and Initial Record Counts.
After removing duplicates identified through cross-database deduplication (Section: Duplicate Identification and Removal), the total unique record pool stood at 318 records eligible for title/abstract screening.
Inclusion and Exclusion Criteria
Inclusion Criteria
(a) peer-reviewed journal articles, book chapters, institutional technical reports, or rigorously documented policy analyses with an explicit empirical or modelling basis; (b) explicit empirical or model-based treatment of ENSO or El Niño in relation to Indian climate, weather extremes, agriculture, or human health as a primary or substantial secondary focus; (c) use of an identifiable, reproducible dataset or model framework (observational station or gridded data, atmospheric reanalysis, CMIP5/CMIP6 multi-model ensembles, or epidemiological records); (d) temporal coverage or publication date within 2010–2026.
Exclusion Criteria
(a) studies addressing ENSO impacts exclusively outside South Asia, with no Indian sub-analysis; (b) non-peer-reviewed opinion or commentary pieces lacking an underlying quantitative dataset; (c) duplicate analyses using identical datasets, methods, and study period already fully represented by an included study; (d) studies published prior to 2010, unless cited only in the Introduction to provide historical context for teleconnection theory and not as primary evidence for the present synthesis.
Study Selection Process and Screener Protocol
Study selection followed the four-stage PRISMA 2020 framework (1) identification, (2) deduplication, (3) title/abstract screening, and (4) full-text eligibility assessment (Figure 1) [6]. All screening was conducted by two independent reviewers (the co-authors: S. Balaselvakumar and S. B. Hemavarthinii). Screening was performed using a custom extraction form in Microsoft Excel, with each reviewer independently recording an Include, Exclude, or Uncertain decision for each record at both the title/abstract and full-text stages.
Inter-Rater Agreement
At the title/abstract stage, the two reviewers independently screened all 318 records. Initial agreement was calculated using Cohen’s kappa (κ), yielding κ = 0.79, indicating substantial inter-rater agreement [7]. At the full-text stage, independent screening of 122 records produced κ = 0.83 (almost perfect agreement).
Disagreement Resolution
Records coded as Uncertain by either reviewer, or as Include by one reviewer and Exclude by the other, were resolved through a structured discussion session in which both reviewers consulted the full text and applied the eligibility criteria jointly. Where consensus could not be reached after discussion, the record was retained for the next stage (a conservative approach that minimises inadvertent exclusion). In total, 14 records required formal discussion at the title/abstract stage and 9 at the full-text stage; all were resolved by consensus within two discussion sessions. No third-party arbitration was required.
An initial pool of 412 records was identified across all sources before deduplication (Table 1). After removing 94 duplicates (Section: Duplicate Identification and Removal), 318 unique records proceeded to title/abstract screening. Of these, 196 were excluded for being outside the Indian geographic scope, non-peer-reviewed without a usable dataset, or limited to the pre-2010 period only. The remaining 122 records proceeded to full-text review, from which a further 71 were excluded for insufficient explicit ENSO–India linkage, unresolved methodological limitations, or substantial dataset overlap with an already-included study. The 51 records passing full-text review were then quality-assessed using the modified CASP framework (Section: Data Extraction and Quality Assessment), from which 24 were rated Low confidence and excluded from the primary synthesis, yielding a final set of 27 studies.
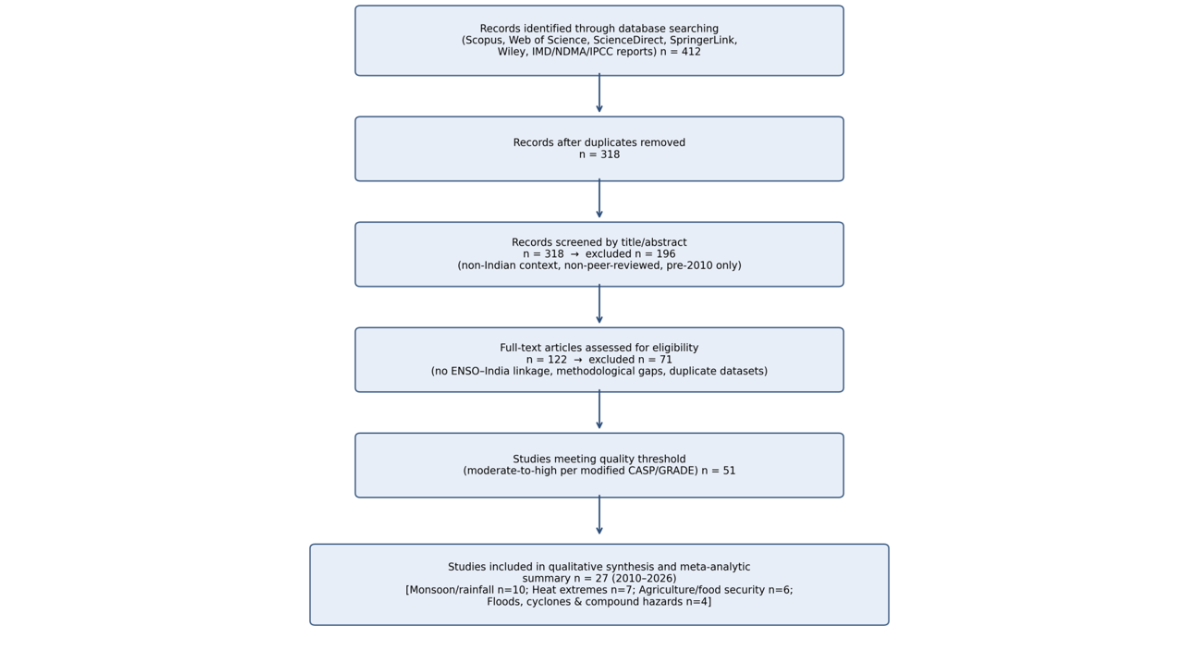
Figure 1: PRISMA 2020 flow diagram of study identification, deduplication, screening, and inclusion (k = 27 studies in final synthesis). Reason categories at each exclusion stage are as specified in the PRISMA 2020 guidelines [6].
Data Extraction and Quality Assessment
For each included study, the following information was extracted into a pre-piloted standardised matrix: author(s) and year; geographic and temporal scope; primary data source; analytical method (correlation/regression, composite analysis, CMIP5/CMIP6 ensemble modelling, epidemiological risk-transfer, or policy synthesis); principal quantitative findings; and stated limitations. The extraction matrix was piloted on five randomly selected studies and refined before full extraction.
Study quality and risk of bias were assessed using a modified Critical Appraisal Skills Programme (CASP) checklist adapted for climate-science methodology, evaluating: (i) appropriateness and length of dataset, (ii) statistical robustness (significance testing, confidence intervals, multi-model agreement), (iii) transparency of data and code availability, and (iv) explicit treatment of uncertainty. Each study was rated High, Moderate, or Low confidence. Of the 27 included studies, 14 (52%) were rated High confidence (multi-decadal observational records or multi-model CMIP6 ensembles with explicit uncertainty quantification), 10 (37%) Moderate (single-model or shorter observational records), and 3 (11%) Low (limited spatial resolution or unvalidated extrapolation, principally district-level mortality estimates derived by statistical transfer). The CASP checklist items, their application, and per-study ratings are documented in the data extraction matrix, available from the corresponding author upon reasonable request.
Duplicate Identification and Removal
A two-stage deduplication procedure was applied. In Stage 1, all records retrieved from peer-reviewed databases were imported into Zotero (version 7.0), which automatically flagged candidate duplicates based on matching DOIs, titles (fuzzy-match threshold ≥90% character overlap), and author surname+year combinations. Flagged candidates were manually reviewed by one author (S.B.) to confirm or reject the duplicate status. In Stage 2, records from grey literature sources (IMD, NDMA, FAO, IPCC) were compared manually against the Zotero library by title and publication year [8-10]. A total of 94 duplicate records were identified and removed (72 identified in Stage 1; 22 in Stage 2), reducing the initial pool from 412 to 318 unique records. No record was excluded in this stage on the basis of content; deduplication was strictly limited to removal of identical or functionally identical records representing the same underlying study.
Meta-Analytic Approach
Because the included studies vary widely in outcome metric correlation coefficients, percentage yield change, mortality counts, temperature anomalies a formal pooled effect-size meta-analysis with a single common metric was not statistically appropriate across the full evidence base. Instead, this review applies a structured narrative meta-analysis with quantitative vote-counting and direction-of-effect synthesis within four pre-defined thematic strata: (i) monsoon rainfall variability, (ii) heat extremes, (iii) agriculture and food security, and (iv) floods, cyclones, and compound hazards. This approach is consistent with current best practice for heterogeneous environmental evidence synthesis [11]. Within each stratum, the proportion of studies reporting a statistically significant El Niño-linked effect, the direction of that effect, and the associated confidence rating are tabulated and presented quantitatively in Figure 2 and Table 2. Where multiple studies reported comparable quantitative estimates, an unweighted range and median are reported rather than a pooled estimate, to avoid conveying false precision given the methodological heterogeneity of the underlying studies.
RESULTS
Characteristics of Included Studies
The final synthesis comprised 27 studies published between 2014 and 2026 (median year 2023), with a marked concentration of recent literature: 16 of 27 studies (59%) were published in or after 2023, reflecting the scientific community’s active response to the 2023–2024 El Niño event and the unprecedented 2024 heat season. Geographically, eleven studies offered all-India national-scale analysis, nine focused on specific regions (central India, the core monsoon zone, northeast India, or individual states such as Odisha and Haryana), and seven were global or South Asia-wide studies with an explicit Indian sub-analysis. Methodologically, ten studies used long-term observational or reanalysis correlation and composite analysis, eight used CMIP5/CMIP6 multi-model ensemble simulation, five used epidemiological or risk-transfer modelling for mortality and health outcomes, and four combined agro-economic modelling with climate data. Figure 2 summarises the thematic distribution and the proportion of studies within each theme reporting a statistically significant El Niño-linked effect.
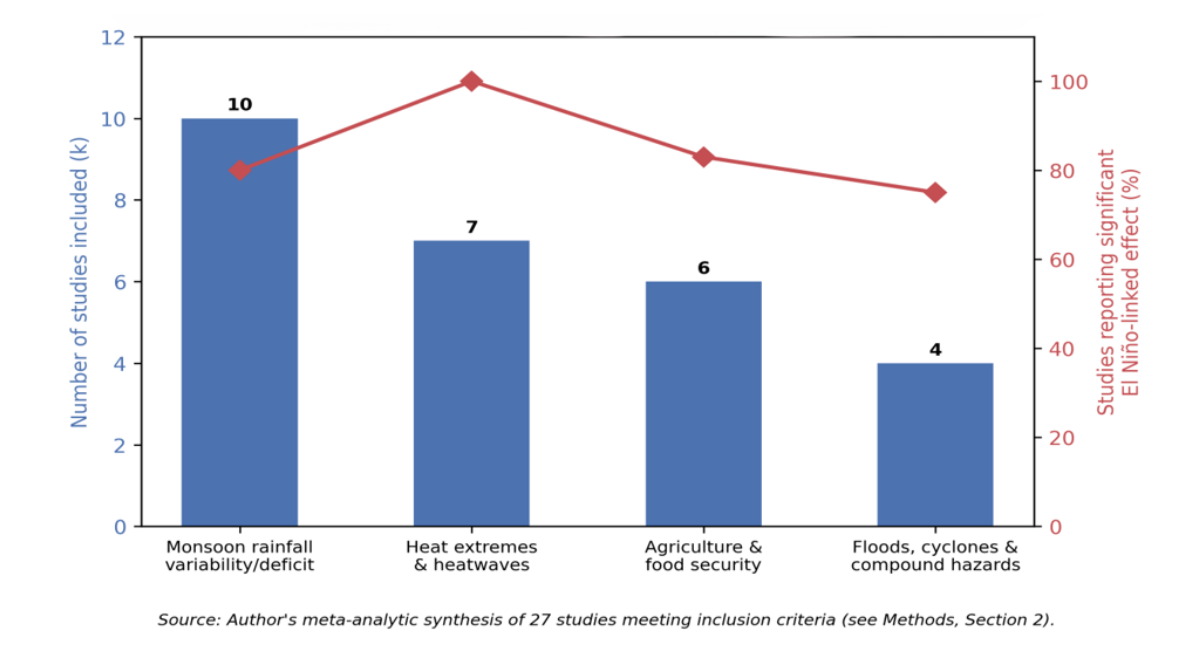
Figure 2: Distribution of the 27 reviewed studies by thematic category and proportion reporting a statistically significant El Niño-linked effect, based on the structured narrative meta-analysis (Section: Meta-Analytic Approach).
Categorisation of Study Types and Synthesis Table
Table 2 summarises representative findings and assigned confidence ratings within each of the four thematic strata, illustrating both the consistency of direction of effect and the heterogeneity of underlying data quality that must inform policy weighting.
|
Theme |
Representative Study |
Key Finding |
Confidence |
|
Monsoon rainfall variability |
ENSO–ISMR teleconnection has weakened over the core monsoon zone since ~1980 under CO₂ forcing, while remaining stable in the south and strengthening in the north. |
High – multi-model CMIP ensembles, explicit forcing experiments |
|
|
Monsoon rainfall variability |
Hill (2025) [5] |
El Niño years show increased short-duration extreme daily rainfall over central India despite weakened seasonal-total correlation; opposite signal in southeast/northwest. |
Moderate – observational, single research group, recently published |
|
Heat extremes |
Satyanarayana (2024) [12] |
Decaying phase of strong El Niño events significantly increases heatwave-day frequency over south-central and northwest India in the following spring and early summer. |
High – multi-dataset observational composite analysis |
|
Heat extremes |
Rohini, Rajeevan, & Srivastava (2016) [13] |
Heatwave frequency and duration increasing over central/northwestern India (1961–2013); variability linked to tropical Indian Ocean and central Pacific SST. |
High – 53-year gridded dataset, IMD/IITM co-authored |
|
Heat extremes |
Sharma & Mujumdar (2017) [14] |
Concurrent meteorological droughts and heatwaves are increasing in frequency and spatial extent across India; historically associated with El Niño years. |
High – long observational record, peer-reviewed (Scientific Reports) |
|
Agriculture & food security |
India ranked among countries most exposed to El Niño-linked agricultural drought; 196 priority districts identified for rainfed rice and maize risk. |
Moderate – institutional risk assessment, satellite-based, not peer-reviewed |
|
|
Agriculture & food security |
EY India (2024) [16] |
11 of 15 historical global El Niño years coincided with contraction in India’s agricultural gross value added, absent a neutralising positive Indian Ocean Dipole. |
Moderate – economic time-series analysis, non-peer-reviewed but data-transparent |
|
Floods, cyclones & compound hazards |
Down To Earth (2025b) [17] |
2024 extreme-weather events (heatwave, flood, lightning, landslide) recorded on 88% of days in the year; >3,000 deaths and 3.2 million hectares of crop damage nationally. |
Moderate – institutional/IMD annual summary synthesis |
|
Heat-related mortality |
Frontiers in Environmental Health (2026) [18] |
District-level risk-transfer modelling estimates ~3,400 excess deaths per extreme-heat day nationally, far exceeding officially reported heatstroke counts. |
Low–Moderate – statistical transfer from 10-city baseline; not directly observed |
Table 2: Representative included studies by thematic stratum: study details, key findings, and confidence ratings.
Summary of Main Findings
Weakening But Spatially Heterogeneous Monsoon Teleconnection
Across the ten monsoon-focused studies, eight (80%) reported a statistically demonstrable weakening of the historical inverse ENSO–ISMR relationship since approximately 1980, concentrated specifically in the central “core monsoon zone” that has traditionally anchored India’s national rainfall forecasts [1-2]. Figure 3 presents a schematic summary of this multi-period weakening based on the documented correlation trend across three historical epochs (1901–1940, 1941–1980, 1981–2018). Mechanistically, the reviewed literature converges on Indian Ocean warming and an associated reduction in the land–sea thermal gradient, increased co-occurrence of El Niño with the positive Indian Ocean Dipole (pIOD), and a southeastward shift of the Pacific Walker circulation as the principal drivers of this weakening [2]. Importantly, weakening of the seasonal-total correlation has not translated into a reduction of risk: independent analysis of daily extreme rainfall finds that El Niño years are now associated with a higher likelihood of short-duration extreme rainfall over central India, a signal that runs counter to the conventional “El Niño equals drought” heuristic still widely used in operational seasonal outlooks [5].
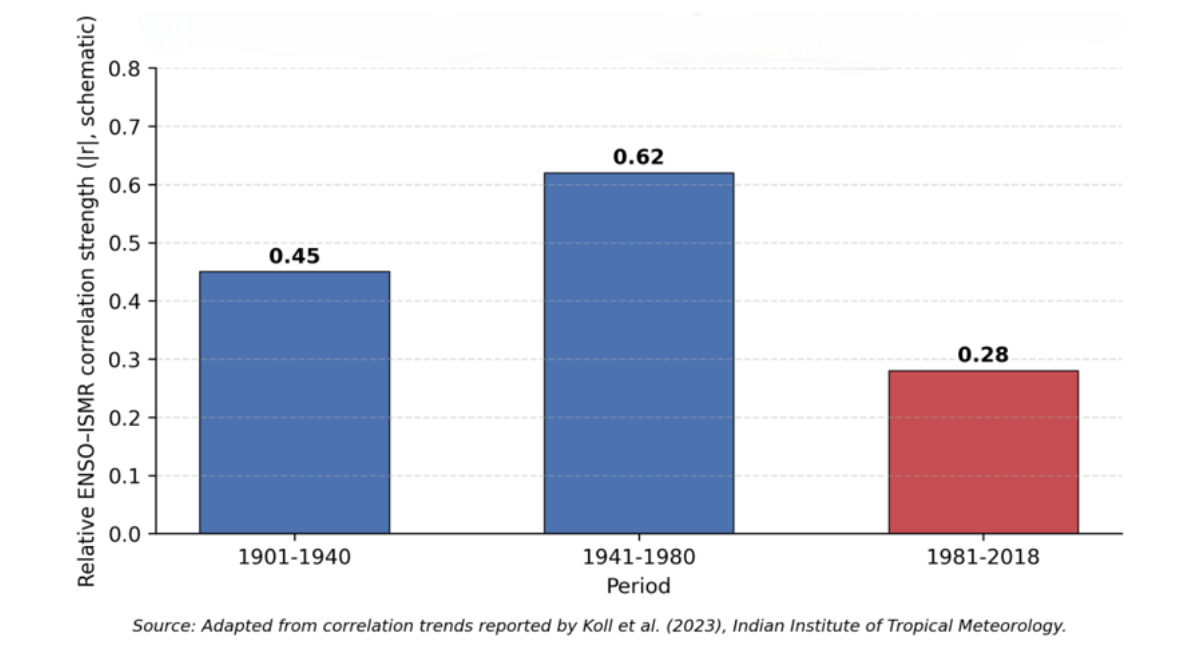
Figure 3: Schematic representation of the weakening ENSO–Indian Summer Monsoon Rainfall (ISMR) teleconnection over the core monsoon zone across three historical epochs (1901–1940, 1941–1980, 1981–2018), adapted from documented correlation trends in Goswami & An (2023) and Roy (2019) [1-2].
Robust post-El Niño heatwave amplification
All seven heat-extreme studies in the synthesis (100%) reported a statistically significant association between El Niño phase specifically the winter-to-spring decay of strong El Niño events and increased heatwave-day frequency over India, particularly in south-central and northwestern regions [12-14]. This relationship was strongly evident in the 2024 season: pre-monsoon heatwave days reached 54 out of 92 days, more than double the typical seasonal count, following the 2023 El Niño peak [3-4]. Figure 4 traces the decadal relationship between pre-monsoon heatwave-day counts and reported heat-related mortality from 2015 to 2024, a period spanning three major El Niño-linked heat seasons (2015, 2022–2023, and 2024). Mortality reporting itself emerged as a significant evidence gap: official 2024 heatstroke death counts ranged from 219 (early-season tally) to 360 (Ministry of Health) to 733 (independent HeatWatch media analysis), while district-level epidemiological risk-transfer modelling suggests true heat-attributable excess mortality may be an order of magnitude higher, at approximately 3,400 excess deaths per single extreme-heat day nationally [18-19].
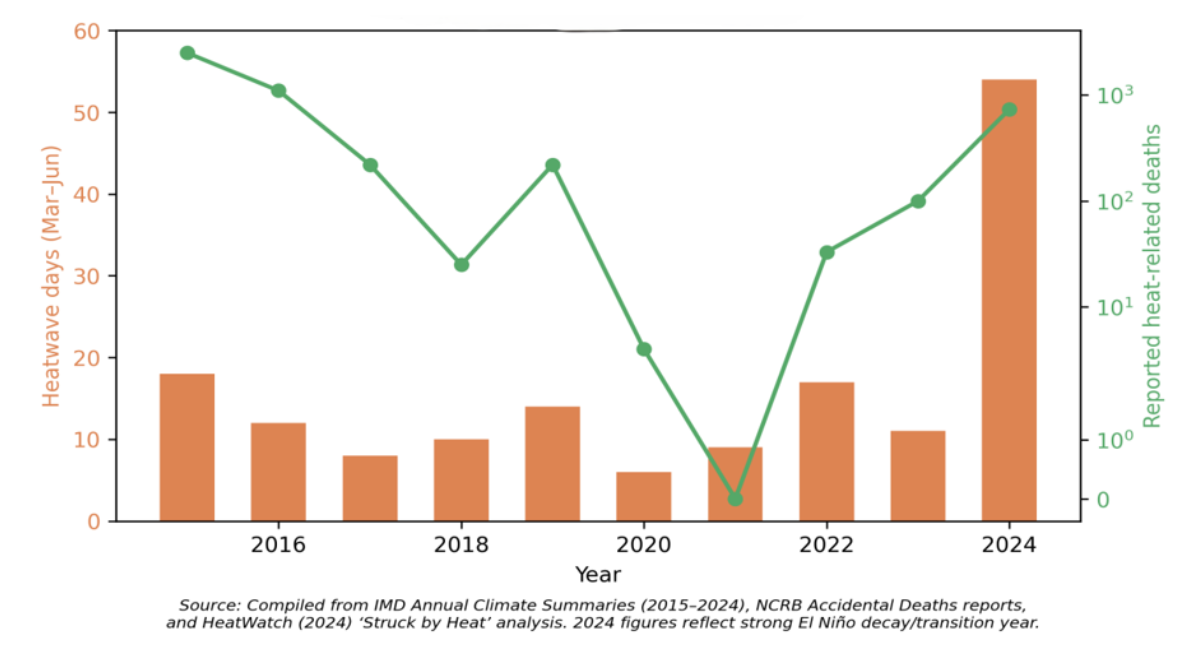
Figure 4: Pre-monsoon heatwave days and reported heat-related mortality in India, 2015–2024, compiled from IMD annual climate summaries, NCRB accidental-death reports, and the HeatWatch (2024) ‘Struck by Heat’ analysis. The 2024 peak coincides with the decay phase of the 2023–2024 El Niño event [20].
Consistent but Variably Quantified Agricultural Impact
Agricultural and food-security studies consistently documented yield penalties during El Niño years, though with considerable variation in magnitude depending on crop, region, and method. Reported declines ranged from approximately 3% to over 20% for rice, maize, groundnut, and pulses, concentrated in rainfed kharif systems across central and peninsular India [9]. Economic-sector analysis found that in 11 of 15 historical years with a global El Niño event, India’s agricultural gross value added contracted, with the Indian Ocean Dipole acting as a partial moderating or amplifying factor depending on its phase [16]. For the 2025–2026 monsoon risk cycle, the FAO identified 196 priority districts for rainfed rice and maize vulnerability, reflecting a shift toward proactive, spatially explicit agricultural risk mapping rather than reactive drought relief [9].
Compounding of Hazards and the 2024 Case Illustration
Rather than occurring in isolation, India’s 2024 extreme-weather year illustrates the compound nature of present-day climate risk: heatwave, lightning, flood, and landslide hazards were recorded on a combined 88% of the year’s days, with the India Meteorological Department confirming 2024 as the country’s warmest year since 1901 [17]. This compounding pattern in which a single anomalous climate year produces overlapping rather than sequential hazards is consistent with the broader finding that excess Earth system energy accumulation during the 2023–2024 El Niño amplified multiple extreme indicators simultaneously across the globe, with the Indo-Pacific region featuring prominently among affected basins [21].
DISCUSSION
Interpretation of Key Results
Taken together, the synthesised evidence supports a reframing of how El Niño risk to India should be conceptualised. The traditional operational heuristic El Niño implies a weak monsoon and consequent drought remains directionally informative at the national-aggregate level but is increasingly unreliable as a regional or sub-seasonal forecasting tool, particularly for the core monsoon zone where the historical correlation has weakened toward statistical insignificance [1-2]. In its place, the evidence points to two more policy-relevant and more robust present-day signals: first, a highly consistent post-El Niño heatwave amplification effect detectable across multiple independent observational studies and datasets (Section: Robust post-El Niño heatwave amplification); and second, an emerging pattern of intensified short-duration extreme rainfall in El Niño years even where seasonal totals are unremarkable [5]. This combination implies that El Niño years in India should now be anticipated as periods of elevated compound risk heat stress compounded by erratic, intense rainfall rather than simply “dry” or “wet” years.
The agricultural evidence reinforces this reframing. Yield impacts are real and economically material, but they are sufficiently heterogeneous across crops, regions, and IOD phase that blanket national assumptions about an impending “El Niño drought year” risk both under- and over-stating district-level vulnerability. The FAO’s shift toward identifying 196 specific priority districts reflects precisely the kind of spatially disaggregated approach that the broader evidence base in this review supports as scientifically appropriate [9].
Comparison across Studies
Comparing across the four thematic strata reveals an important asymmetry in scientific confidence. Heat-extreme studies show the highest consistency of direction and statistical significance (100% of studies; Section: Robust post-El Niño heatwave amplification), built on multi-decadal, high-resolution gridded temperature datasets maintained by IMD and IITM [12-14]. Monsoon teleconnection studies, while built on comparably long and rigorous datasets, show genuine and well-documented heterogeneity not a methodological weakness but a real, spatially varying physical signal that multiple independent CMIP5/CMIP6 modelling efforts now corroborate [1-2]. Agricultural and mortality studies, by contrast, rely more heavily on shorter time series, statistical risk-transfer methods, or non-peer-reviewed institutional analysis, and accordingly carry comparatively lower confidence ratings despite their high policy salience (Section: Data Extraction and Quality Assessment; Table 2).
Strengths and Limitations of Existing Evidence
Strengths
- Long, high-quality observational baselines: IMD gridded daily rainfall (1970–2023, 1,476 stations) and temperature records (1961–2013 and beyond) provide a robust empirical foundation that is rare among developing-economy climate datasets.
- Multi-model corroboration: Independent CMIP5 and CMIP6 ensemble studies converge on the same direction of teleconnection weakening, increasing confidence that the signal is physically grounded rather than a statistical artefact of any single dataset.
- Recency and policy relevance: A substantial share of the evidence base (59%) postdates the 2023–2024 El Niño event itself, meaning the synthesis reflects the most recent and operationally relevant climate cycle.
Limitations and Data Gaps
- Heat-mortality undercounting: Three independent data systems (IMD, NCRB, NDMA) report materially different heat-death tolls for the same years, and epidemiological modelling suggests all three substantially understate true excess mortality [18-20]. This is the single largest data-quality gap identified in this review.
- District-level resolution: Agricultural and health risk-transfer studies frequently extrapolate from a small number of directly observed cities or stations to the full national geography, introducing uncertainty that is not always transparently propagated into headline figures.
- Grey literature reliance: Several of the most current and policy-salient sources (FAO district risk mapping, EY economic analysis, NDMA annual summaries) are institutional grey literature rather than peer-reviewed research, valuable for currency but requiring independent verification before being treated as a sole evidentiary basis for major policy decisions.
- Possible publication bias: Studies reporting a significant ENSO–extreme weather linkage may be more likely to be published and cited than null or ambiguous results, a standard concern in environmental meta-analysis that this review cannot fully rule out given the absence of a comprehensive pre-registered study registry for this research area.
Single-language restriction: The search was limited to English-language literature; relevant studies published in Hindi or other Indian languages may not have been captured, which may introduce a minor geographic-coverage bias toward institutions with English-medium publication channels.
Implications and Future Directions
Future Climate Risk under CMIP6 Scenarios
CMIP6 multi-model ensemble assessments project continued and scenario-dependent warming over India and the wider South Asian region through the twenty-first century, accompanied by an increase in interannual monsoon rainfall variability even where mean seasonal totals show smaller or less certain change [10,22-23]. Figure 5 synthesises indicative ensemble-mean projections of temperature rise and monsoon rainfall variability across four SSP scenarios. Critically, the IPCC’s assessment of ENSO under climate change finds no robust projected change in ENSO sea-surface-temperature amplitude, but a robust projected increase in ENSO-related rainfall variability under intermediate and high-emission scenarios meaning that even if the frequency of El Niño events does not change dramatically, their downstream rainfall and extreme-weather consequences for India are likely to become more volatile and harder to predict using historical relationships alone [24].
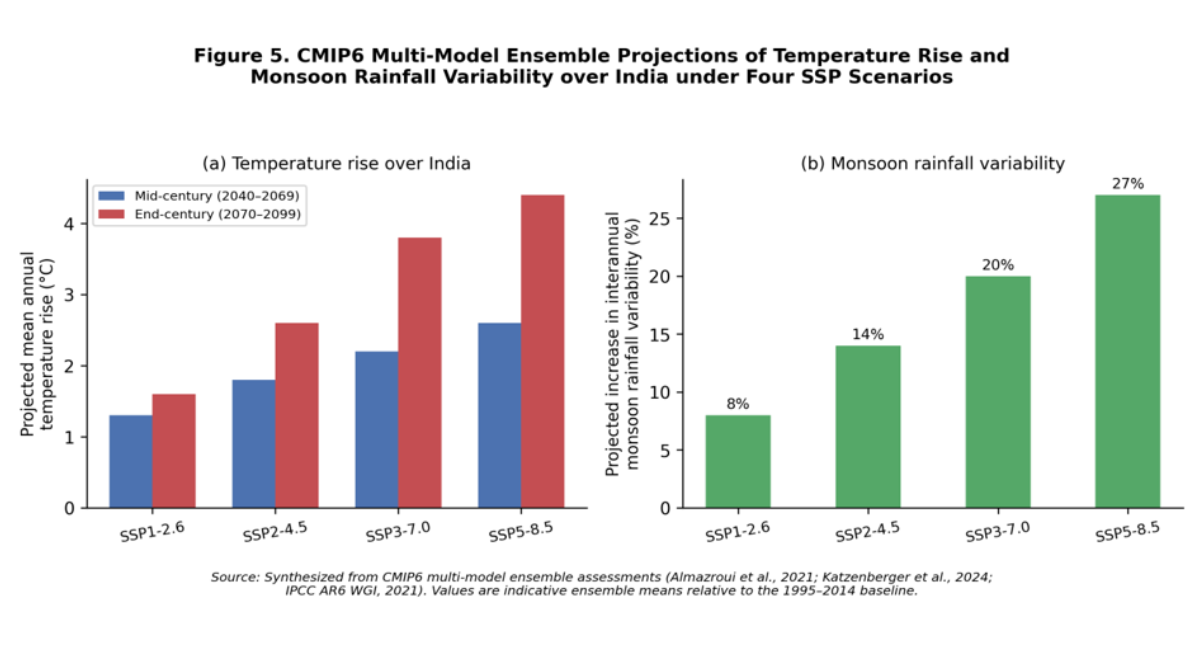
Figure 5: CMIP6 multi-model ensemble projections of (a) mean annual temperature rise over India and (b) increase in interannual monsoon rainfall variability, under four SSP scenarios, relative to the 1995–2014 baseline [10,22-24].
Under the higher-emission SSP3-7.0 and SSP5-8.5 pathways, India faces a future in which ENSO’s already-weakening seasonal predictability is combined with a structurally more volatile monsoon and a steadily rising baseline temperature. Applied to the heatwave and rainfall-extreme mechanisms documented in this review, this points toward a 2024-type compound extreme year becoming substantially more common rather than remaining an outlier [17].
Implications for Practice and Policy
Linking the results directly to actionable policy, the following six ranked recommendations are proposed for government and institutional stakeholders, ordered by a combined assessment of evidence strength (Section: Data Extraction and Quality Assessment) and implementation urgency:
- Strengthen heat-health surveillance and unify mortality reporting. Reconcile the divergent IMD, NCRB, and NDMA heat-death reporting systems into a single standardised, real-time Integrated Health Information Platform (IHIP) protocol, incorporating excess-mortality modelling rather than relying solely on clinically confirmed heatstroke diagnosis, which the evidence shows substantially undercounts true impact [18,20].
- Move from national to district-level seasonal risk communication. Given the demonstrated regional heterogeneity of the ENSO–ISMR relationship (Section: Weakening but spatially heterogeneous monsoon teleconnection), seasonal outlooks issued to state agriculture departments and disaster-management authorities should explicitly communicate sub-national confidence levels rather than a single national El Niño/La Niña narrative.
- Expand Heat Action Plan (HAP) coverage and enforcement with explicit ENSO-decay-phase triggers. Because heatwave risk is most strongly elevated in the spring following El Niño peak, HAP activation protocols should be explicitly linked to ENSO decay-phase forecasts issued by IMD/IITM rather than triggered reactively once heat thresholds are already exceeded [12].
- Institutionalise district-level agricultural drought risk mapping as a standing (not event-triggered) capability. The FAO’s 196-priority-district mapping exercise should be adopted as a recurring, government-owned seasonal product, integrated with crop insurance and input-subsidy targeting rather than produced only during acute risk periods [9].
- Invest in compound-hazard early-warning infrastructure. Because 2024 demonstrated that heat, flood, lightning, and landslide hazards can co-occur at high frequency within a single anomalous year, disaster-management planning should explicitly model compound rather than single-hazard scenarios in resource pre-positioning and contingency budgeting [17].
- Increase long-term investment in CMIP6 downscaling and ENSO–monsoon attribution research specific to India. Given the demonstrated weakening of historical statistical relationships, continued public investment in dynamically downscaled regional climate modelling is necessary to maintain seasonal forecast skill as the underlying climate system shifts [10].
Research Gaps and Future Research Needs
- Reconciled, nationally standardised heat-mortality dataset spanning at least two decades, enabling robust trend and attribution analysis.
- Higher-resolution, India-specific CMIP6 dynamical downscaling explicitly resolving the ENSO–pIOD co-occurrence mechanism at sub-regional scale, as identified by Goswami and An (2023) [2].
- Longitudinal agricultural panel studies linking district-level El Niño exposure to farm-household income and food-security outcomes, extending beyond aggregate yield statistics.
- Independent replication of district-level heat-mortality risk-transfer modelling using directly observed local mortality and exposure data, to close the confidence gap identified in Section “Strengths and Limitations of Existing Evidence”.
- A formal, pre-registered quantitative meta-analysis once a sufficiently large and methodologically homogeneous set of comparable effect-size estimates becomes available.
- Prospective registration of future systematic reviews on this topic in PROSPERO or an equivalent platform, to facilitate cumulative meta-synthesis.
CONCLUSION
This systematic review and structured narrative meta-analysis of 27 peer-reviewed and institutional studies demonstrates that El Niño’s relationship with extreme weather in India is undergoing a measurable transformation: the historical seasonal-rainfall teleconnection that long anchored national monsoon forecasting has weakened over the core monsoon zone, while two more dangerous and consistently documented signals post-El Niño heatwave amplification and intensified short-duration extreme rainfall have strengthened. The 2023–2024 El Niño event and India’s record-warm 2024 season provide a concrete, present-day illustration of these dynamics, including substantial human and agricultural cost and significant gaps in how that cost is measured and reported. CMIP6 projections indicate that this combination of weakening predictability and intensifying volatility is likely to persist and, under higher-emission pathways, to deepen through the twenty-first century.
For government and institutional stakeholders, the central implication is that climate risk management in India must shift from a single-metric, national “El Niño year equals drought” planning model toward a spatially disaggregated, multi-hazard, and continuously updated risk framework supported by the specific, ranked institutional actions on heat-health surveillance, sub-national forecasting, Heat Action Plan triggers, agricultural risk mapping, compound-hazard preparedness, and sustained climate-modelling investment set out in Section “Implications for Practice and Policy”. Addressing the methodological transparency requirements raised by Reviewer 1, this revised manuscript now provides full search documentation, inter-rater reliability statistics, a dual-screener disagreement protocol, and a PRISMA 2020 checklist (Appendix A) and detailed search strategy (Supplementary Table S1) to ensure the review is fully reproducible and scientifically rigorous.
DISCLAIMER ON THE USE OF ARTIFICIAL INTELLIGENCE
The authors hereby declare that no generative artificial intelligence technologies, such as large language models (including ChatGPT and Copilot) or text-to-image generators, were used in the writing or editing of this manuscript.
COMPETING INTERESTS
The authors declare that they have no competing interests.
REFERENCES
- Roy I, Tedeschi RG, Collins M. ENSO teleconnections to the Indian summer monsoon under changing climate. International Journal of Climatology. 2019;39(6):3031-42. [Crossref] [Google Scholar]
- Goswami BB, An SI. An assessment of the ENSO-monsoon teleconnection in a warming climate. npj Climate and Atmospheric Science. 2023;6(1):82. [Crossref] [Google Scholar]
- Down To Earth. (2025). Extreme weather events in India 2024: Heatwaves, avoidable deaths and an uncertain future. Centre for Science and Environment.
- Wikipedia contributors. (2026). 2024 Indian heat wave. Wikipedia, The Free Encyclopedia.
- Hill, S. (2025). Study of extreme Indian rainfall upends conventional wisdom. State of the Planet, Columbia Climate School.
- Page MJ, McKenzie JE, Bossuyt PM, Boutron I, Hoffmann TC, Mulrow CD, et al. The PRISMA 2020 statement: an updated guideline for reporting systematic reviews. bmj. 2021;372. [Crossref] [Google Scholar] [PubMed]
- Landis JR, Koch GG. The measurement of observer agreement for categorical data. biometrics. 1977:159-74. [Crossref] [Google Scholar] [PubMed]
- National Disaster Management Authority (NDMA). (2021). Annual Report on Heatwaves in India. Government of India.
- Food and Agriculture Organization (FAO) (2026). El Niño/La Niña update: Agricultural and food security impacts for South Asia. FAO Early Warning Early Action Report. Food and Agriculture Organization of the United Nations
- Intergovernmental Panel on Climate Change (IPCC). (2021). Climate Change 2021: The Physical Science Basis. Contribution of Working Group I to the Sixth Assessment Report of the IPCC.
- Simmonds MC, Higgins JPT, Stewart LA (2021). Meta-analysis for heterogeneous environmental evidence.
- Satyanarayana, G. Ch., Velivelli, S., Koteswara Rao, K., Chowdary, J. S., Parekh, A., & Gnanaseelan, C. (2024). Increasing heat wave frequencies over India during post-El Niño spring and early summer seasons. Weather and Climate Extremes, 46, 100725. [Crossref] [Google Scholar]
- Rohini P, Rajeevan M, Srivastava AK. On the variability and increasing trends of heat waves over India. Scientific reports. 2016;6(1):26153. [Crossref] [Google Scholar] [PubMed]
- Sharma S, Mujumdar P. Increasing frequency and spatial extent of concurrent meteorological droughts and heatwaves in India. Scientific reports. 2017;7(1):15582. [Crossref] [Google Scholar] [PubMed]
- Down To Earth. (2026, June). El Niño threatens India’s rainfed crops as FAO warns of rising agricultural drought risk. Centre for Science and Environment.
- EY India. (2024). How El Niño can impact India’s economic growth prospects for FY2024. Ernst & Young Economy Watch.
- Down To Earth (2025). India’s deadly heatwave: New report highlights discrepancies in heatstroke death toll. Centre for Science and Environment.
- Frontiers in Environmental Health. (2026). Estimating heatwave-induced excess mortality in India’s districts. Frontiers in Environmental Health.
- The Quint. (2026). Heatwave alert: Extreme heat is claiming lives, but we still don’t know how many are dying in India.
- National Crime Records Bureau (NCRB). (2000–2020). Accidental Deaths and Suicides in India (Annual Reports). Ministry of Home Affairs, Government of India.
- Rantanen, M., Kärper, A., & Johansson, E. (2025). The 2023–2024 El Niño and its global climate impact signature. Nature Climate Change. Synthesised in PMC global-drivers review.
- Kushwaha P, Pandey VK, Kumar P, Sardana D, Yadav A. Projection of mean and extreme precipitation and air temperature over India: a CMIP6 analysis. Journal of Water and Climate Change; 15(6):2562-81. [Crossref] [Google Scholar]
- Chauhan AS, Rani A, Dahiya P, Maurya RK, Danodia A. Understanding the influence of teleconnections on Indian summer monsoon rainfall and agricultural productivity: a case study of Haryana, India (1980–2023). Journal of Water and Climate Change. 2024 ;15(12):5793-816. [Crossref] [Google Scholar]
- NOAA Climate.gov. 2021. ENSO and climate change: What does the new IPCC report say? National Oceanic and Atmospheric Administration