Journal of Global Research Frontiers and Innovation (Annual (One issue per year))
ABSTRACT
Most assessments of national sustainability report where a country stands today; few indicate the path it still has to travel. This paper argues that Organic Growth Theory (OGT) provides such a forward-looking approach to global sustainable competitiveness. OGT, originally developed for corporations, is extended here to countries (OGT 2.0). The three phases of ecological thinking (egocentric, ethnocentric and worldcentric) define the direction of growth, and the five maturity levels of Capability Maturity Model Integration (CMMI) measure progress within each phase. Together they form a 15-point scale whose end point is the “Wortry” (world country), a country that grows without compromising the ability of future generations to meet their needs. The Sustainable Development Goals are grouped into three dimensions, namely economy, society and environment, which are measured by gross domestic product (GDP), the Human Development Index (HDI) and total carbon-equivalent emissions, respectively. The framework is applied to three blocs of power (the United States, the European Union and China), and a sensitivity analysis compares their scores before the COVID-19 pandemic (December 2019) with those in August 2021. The combined score of the three blocs fell by 3.03%: the scores of the United States and the European Union declined, whereas that of China increased. It is concluded that the pandemic paused the evolution of these blocs towards becoming truly worldcentric. The recovery plans, however, appear to be closely aligned with the OGT dimensions, and the scores are expected to improve as these plans take effect.
Keywords: Organic Growth Theory; Sustainable Competitiveness; Sustainable Development Goals; Ecological Thinking; Capability Maturity Model Integration; COVID-19
INTRODUCTION
Organic Growth Theory (OGT) was first introduced for corporations in [1], following extensive engagement with, and input from, stakeholders in the sustainability community around the world. The concept was published openly and has contributed to the development of sustainable businesses. The purpose of OGT is to define an incremental approach to growth and revenue generation that does not compromise the capacity of future generations to satisfy their needs [1-3].
The theory was originally tailored to the corporate world. This paper extends it to countries and to the global economy. Its central argument is that OGT provides a forward-looking approach to global sustainable competitiveness, understood here as the ability of a country to grow and create jobs without compromising the ability of future genera-tions to meet their needs. Existing sustainability indices mainly rank countries on what they have already achieved. OGT instead locates each country on a staged path, from egocentric through ethnocentric to worldcentric, and thereby indicates the next step the country needs to take.
The paper makes three contributions. First, it adapts OGT to countries (OGT 2.0) by combining the three phases of ecological thinking with the five maturity levels of Capability Maturity Model Integration (CMMI), and it introduces the “Wortry” (world country) as the end point of the resulting path. Second, it links this framework to the Sustainable Development Goals (SDGs) through three measurable dimensions: economy, society and environment. Third, it applies the framework to three blocs of power (the United States, the European Union and China) and uses the COVID-19 pandemic as a sensitivity case to show how a global shock changes their positions on the path.
The remainder of the paper is organized as follows. Section 2 gives the background and the justification for the approach. Section 3 reviews the literature on measuring sustainability at country level. Section 4 summarizes the original OGT for corporations. Section 5 adapts OGT to countries and explains how its components fit together. Section 6 presents the results, including the COVID-19 sensitivity analysis. Section 7 concludes with the main contribution, the practical implications and the outlook for future research.
BACKGROUND
The Sustainable Development Goals, adopted by the member states of the United Nations and in effect since 1 January 2016, set out a vision of and a pathway to a global, sustainable future. The 17 goals form an ambitious agenda for humanity: to eradicate hunger and poverty, to create efficient and sustainable industrial structures, to counter the effects of climate change and to maintain a habitable and healthy planet [4]. The UN 2030 Agenda identifies “leaving no one behind” as a core value and requires every country to act and to collaborate towards a collective transformation. All countries, whatever their size and stage of development, are therefore expected to join their efforts to achieve the SDGs fully and on time.
In line with this direction, corporations worldwide are broadening their definition of value by incorporating sus-tainability into their decision-making processes [5,6]. The commitment of top management and the support of gov-ernments are among the most important factors enabling industries to move in a sustainable and circular direction [7]. Governments can facilitate this transformation by providing incentives and funding to industrial organizations, by supporting change and by creating a collaborative atmosphere [8].
Quantifying sustainability is a vital step in any such transformation, because it makes it possible to measure sus-tainability and to set specific targets [5]. What cannot be measured cannot be managed or improved; the most appro-priate indicators and indices for assessing sustainability have therefore been investigated and modelled in many do-mains [9]. Decision-makers and policymakers can use sustainability assessment as a tool for deciding which measures to take in order to make society more sustainable [10].
Sustainability performance measurement has consequently become an active field of research, with notable con-tributions from many scholars [11,12]. Measuring the sustainability performance of countries makes it possible to understand the strengths and weaknesses of each country, to track its performance over time, to benchmark it against other countries and to guide its policymaking [13-15]. What such measurement usually does not provide is a sense of direction, that is, an indication of the stage of development a country should aim for next. This gap motivates the ex-tension of OGT to countries in this paper.
LITERATURE REVIEW
Measuring sustainability is a vital but challenging task. One of the main challenges at country level is uncertainty in the data, which may arise from ambiguous or incomplete information, from uncertainty in the data series or from uncertainty about the future [16]. To represent the true nature of the problem, the models used in sustainability as-sessment should therefore capture the qualitative, quantitative and uncertain characteristics of the parameters involved [10].
One of the earliest and best-known indices is the Human Development Index (HDI), introduced by the United Nations Development Programme in 1990. The Environmental Performance Index (EPI) and the Ecological Footprint (EF) are also among the most widely recognized performance indicators. The methods used for sustainability perfor-mance assessment include multi-criteria decision analysis, data envelopment analysis (DEA), life cycle analysis (LCA), comprehensive evaluation, system dynamics and fuzzy set theory [10,16].
Despite the efforts of researchers and of the United Nations, the term sustainability remains vague and difficult to quantify [17,18]. Moreover, different conceptualizations of sustainability and different quantification methods lead to different, and sometimes contradictory, results [9,16,19].
Because sustainability is assessed through a number of indicators, measuring sustainability performance at the macro level (city or country) can be regarded as a classic multiple criteria decision aiding (MCDA) problem [19-21]. Since the start of the twenty-first century, numerous intergovernmental plans and private programmes have been launched to encourage sustainable development across the world. They include the New Urban Agenda of UN-Habitat (2016), the Sustainable Development Goals of the United Nations (2016), the Istanbul Declaration of the North Atlantic Treaty Organization (NATO) (2004) and the HK2030 Study of the Hong Kong Planning Department (2007). The OECD has also issued several sets of guidelines and methods for evaluating sustainable development [22].
Indices are central to ensuring that sustainable development is actually put into practice. Examples include the Sustainable Development Goals (SDG) Index [23], the Genuine Progress Indicator [24], the Global Innovation Index [25], the Environmental Performance Index [26], the Sustainable Society Index [27] and the Legatum Prosperity Index [28]. Published by different organizations, these indices help to keep the concept of sustainability alive while addressing and measuring several dimensions of sustainable development [29]. A circular economy (CE) is also regarded as a requirement for lasting sustainable development, because it improves resource efficiency and reduces material dependence [22].
Energy generation has to meet three requirements in order to be part of sustainable development [30-33]:
- The source of energy is not significantly depleted by continued use.
- Its use does not emit pollutants or create other hazards to human, ecological or climate systems on a significant scale.
- It does not perpetuate significant social injustices.
Country-level studies illustrate what such measurements reveal. For China, Zhang et al. [5] found that economic growth before 2005 was not sustainable, owing to environmental problems and large income gaps. This changed after the Chinese government announced goals for sustainable development in its 11th Five-Year Plan (2006–2010), which included proposals for environmental pollution regulation and for reducing the income gap [34]. These policies appear to have been effective in increasing the sustainability performance of the country. China nevertheless placed more emphasis on economic performance than on environmental and social performance. Social performance, which rep-resents economic equality, had the lowest value, suggesting that the country’s sustainability inefficiency stemmed mainly from social inefficiency.
For Europe, Cucchiella et al. [16] presented a method for calculating and comparing the sustainability performance of European countries. Sweden, Denmark, Finland and Austria have the highest sustainability indices, and Sweden ranks first in both the environmental and the energy assessments [16,35].
Taken together, these studies show that the sustainability of countries can be measured in many ways, but that the resulting indices are primarily descriptive. The framework presented in Sections 4 and 5 complements them by adding a staged path of development against which such measurements can be read.
THEORETICAL FRAMEWORK
Organic Growth Theory
A clear vision of impact, and a strategy that supports this vision, are the basic elements of a forward-looking ap-proach to corporate growth. From this perspective, the materiality, measurability and scalability of impact are the guiding principles. Impact-driven growth also requires corporations to put effective transparency mechanisms in place in order to realize the benefits of this approach [12,36]. OGT rests on three main assumptions:
- Growth is important, but only growth that has a positive impact.
- Growth is guided by Maslow’s hierarchy of needs and by an incremental process based on ecological thinking [1].
- The focus is on improving internal efficiency and impact.
In OGT, Foundation Corporates (“Founcorps” for short) are described as the next generation of corporations. Founcorps bring profound motives and impactful visions to corporate growth. As stated above, OGT builds on two established concepts: Maslow’s hierarchy of needs and ecological thinking [1,36]. The former is a motivational theory in psychology comprising a five-tier model of human needs, usually depicted as hierarchical levels within a pyramid (Figure 1).
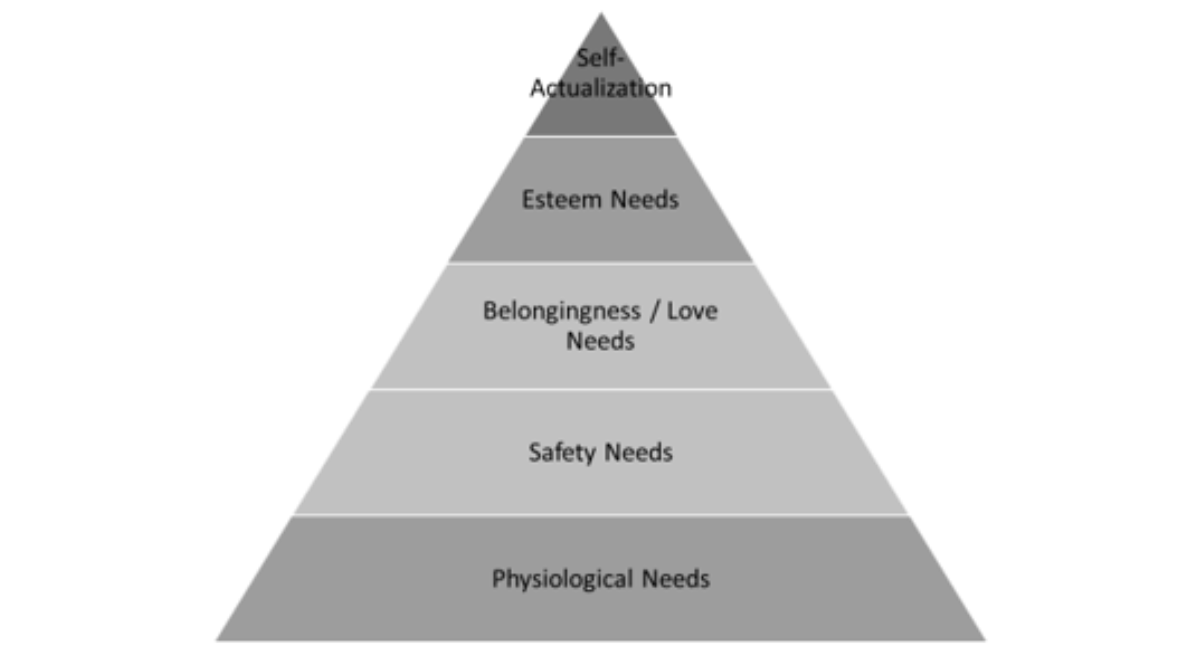
Figure 1: Maslow’s hierarchy of needs.
Individuals cannot attend to more advanced needs until the needs lower in the hierarchy have been met. From the bottom of the hierarchy upwards, the needs are physiological, safety, love and belonging, esteem, and self-actualization. OGT translates these five levels to the corporate setting, as shown in Table 1.
|
Level |
Maslow’s hierarchy |
Individual |
Corporate |
|
1 |
Physiological needs |
Oxygen, food, water, sleep |
One employee, product or service, business strategy, small funds, stationery, phone, computer, internet |
|
2 |
Safety needs |
Protection, security, order, law, limits, stability |
Stream of revenue, multiple employees, steady retention rate, office space |
|
3 |
Belongingness and love needs |
Family, affection, relationships |
Employee relations, investors, clients |
|
4 |
Esteem needs |
Achievement, status, responsibility, reputation |
Brand recognition, partnerships, IPO, press coverage |
|
5 |
Self-actualization |
Personal growth, fulfilment |
Corporate citizenship, corporate social responsibility |
Table 1: Maslow’s hierarchy of needs for individuals and its corporate equivalent in OGT.
For a corporation, the hierarchy starts with basic needs such as a strategy and funds and leads up to sustainability, corporate citizenship and corporate social responsibility (CSR). Aramco, the largest oil company in the world, is an interesting example: its entire CSR focus is on corporate citizenship [2]. While all CSR activities are valuable, corporate structures also need to evolve so that growth itself is responsible. OGT describes this growth path, and its goal is for corporations to evolve into responsible entities called Founcorps.
In the OGT framework, the five steps in Table 1 have to be repeated in three successive phases before a corporation becomes a true Founcorp. These three phases come from the concept of ecological thinking [1] and are illustrated in Figure 2. In the egocentric phase, the concern of the corporation is limited to its own interests. In the ethnocentric phase, this concern extends to the group to which the corporation belongs, such as its stakeholders and its community. In the worldcentric phase, it extends to all people and to the planet.
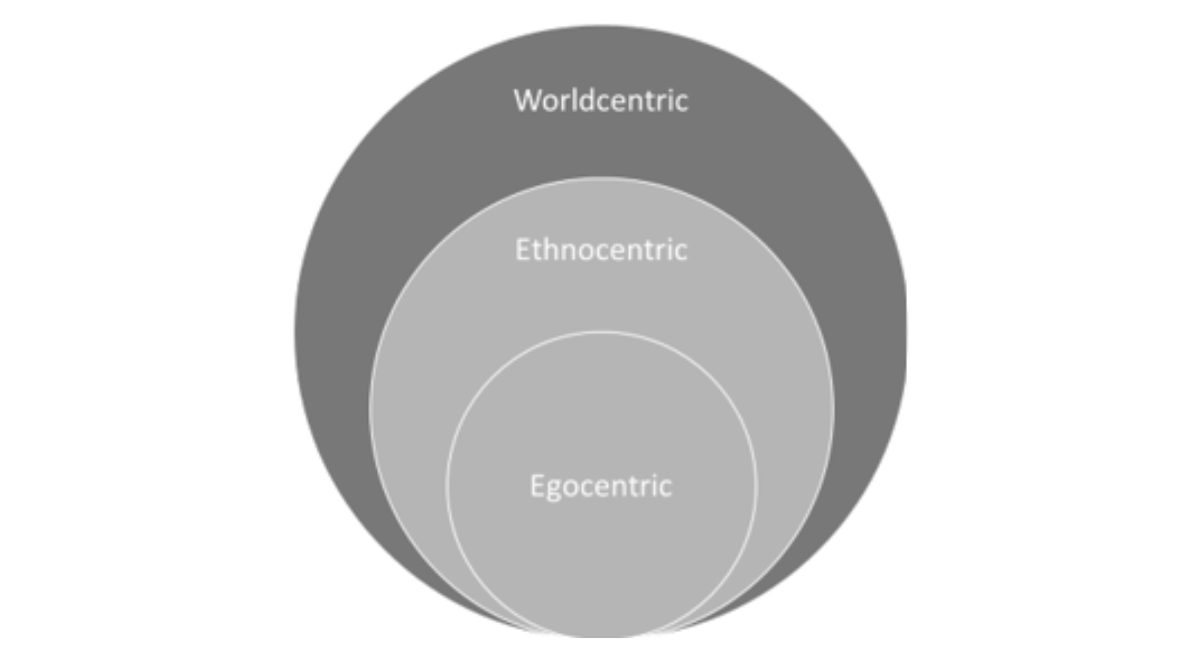
Figure 2: The three phases of ecological thinking [1].
Ecological thinking is a natural way for responsible corporations to work and grow. It allows them to take part in the natural rebalancing process in the lives of people and of nature [3], to serve the entire interdependent web of nature and life, and to create value for both people and nature. Figure 3 summarizes the nine steps required to become a Founcorp.
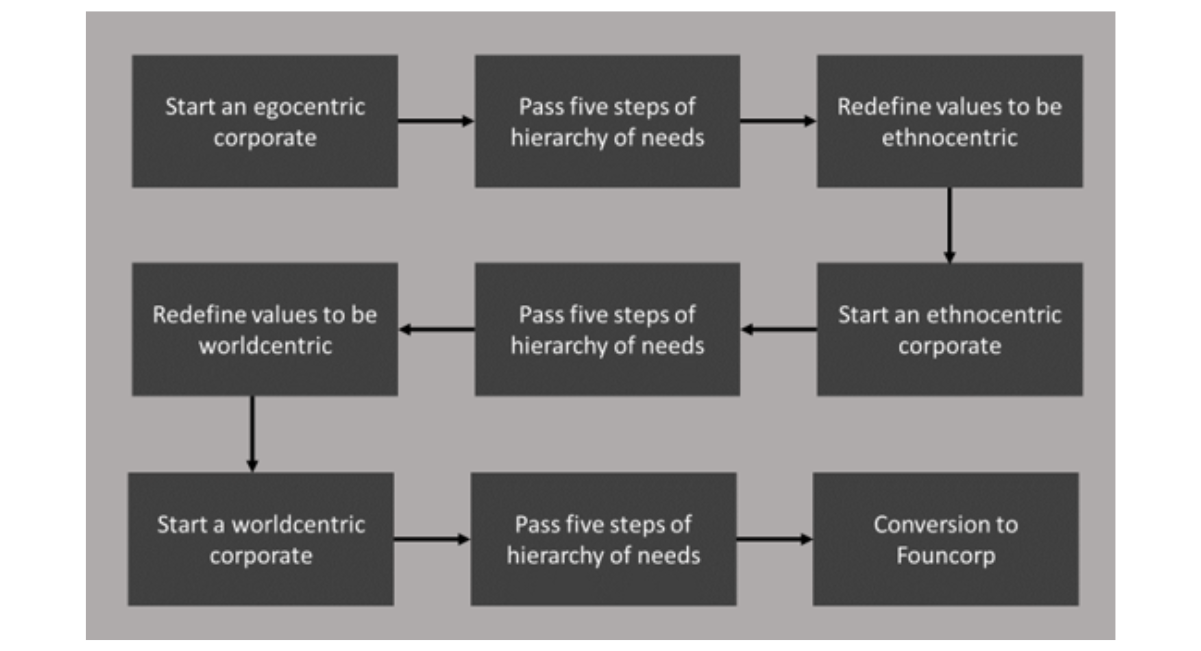
Figure 3: The nine steps required for a corporation to become a Founcorp in the OGT framework.
As Figure 3 shows, climbing the five levels of Maslow’s hierarchy of needs is necessary for growth, but it is not sufficient: the five levels have to be climbed in each of the three phases of ecological thinking [1]. A corporation that completes this path is a Founcorp, that is, a worldcentric corporation with meaningful reasons and impactful visions for growth. In other words, ecological thinking defines for whom a corporation grows, and Maslow’s hierarchy measures how far it has progressed. Section 5 carries the same two-part logic over to countries.
Organic Growth Theory for Global Sustainable Competitiveness
This section adapts OGT to countries. The adaptation keeps the logic of Section 4, a direction of growth combined with a measure of progress, but replaces the components that are specific to corporations.
Policymakers used to regard sustainability as an additional overhead cost, incurred to mitigate risk and to make a “compensating” positive impact. This view is no longer tenable. The world has reached a turning point of instability, mainly because of climate change but also because of the emergence of COVID-19, and further investment in non-sustainable alternatives now poses an existential threat to everyone. At the same time, the cost of sustainable technologies has reached parity with that of non-sustainable alternatives. OGT [1] therefore offers a step-by-step ap-proach by which the world’s economy can grow and create more jobs without compromising the ability of future generations to meet their needs.
Organic Growth Theory for Countries: OGT 2.0 and the Wortry
Applied to countries, OGT describes a path along which a country evolves from an egocentric country, through an ethnocentric country, to a worldcentric country. In this paper, an egocentric country is one whose policies primarily serve its own immediate interests; an ethnocentric country extends its concern to the group to which it belongs, such as its allies or its region; and a worldcentric country takes responsibility for all people and for the planet. The end point of the path is the “Wortry” (world country). The Wortry is the country-level counterpart of the Founcorp. It is the proposed way of governing a country in order to address the challenges described above, and it directs countries to evolve and to take responsibility for the planet. The path is shown in Figure 4.
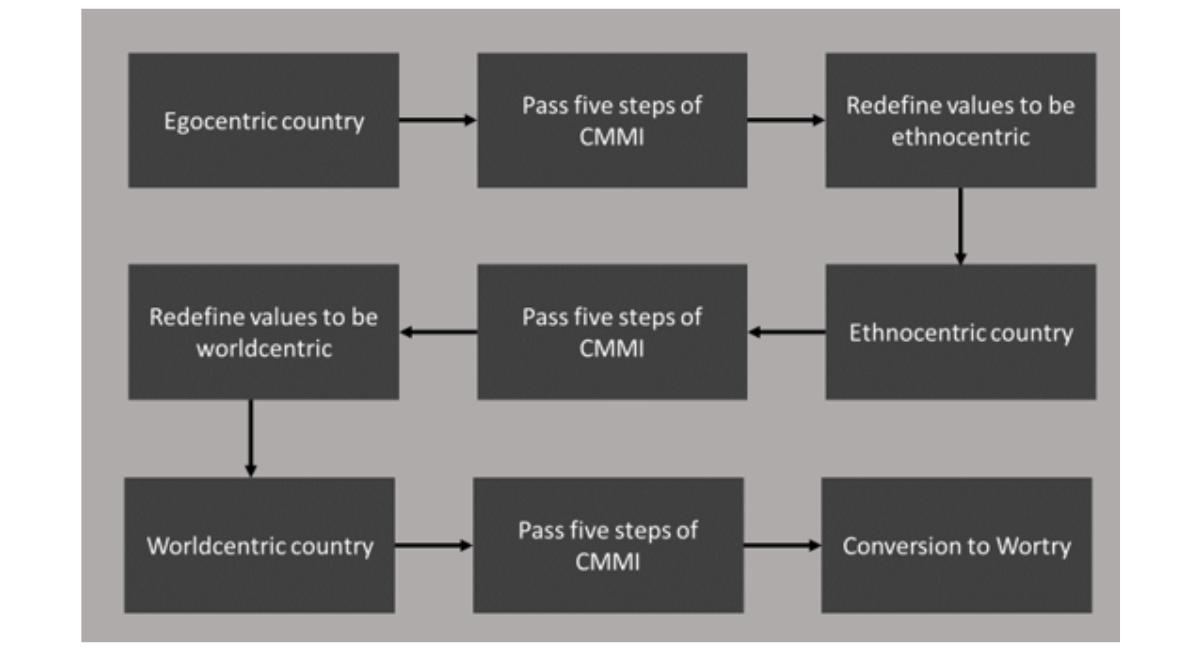
Figure 4: Organic Growth Theory for countries (OGT 2.0): the nine steps from an egocentric country to a Wortry.
The version of OGT used in this paper, referred to as OGT 2.0, differs from the original in one respect. The three phases of ecological thinking are retained, but Maslow’s hierarchy of needs is replaced by the five maturity levels of Capability Maturity Model Integration (CMMI) [37]. Maslow’s hierarchy describes needs, which were translated to corporations in Table 1, whereas CMMI describes the maturity of processes, which can be assessed for the policies and institutions of a country. Table 2 summarizes how the components of the two versions relate to one another. In short, ecological thinking sets the direction of growth, CMMI measures progress within each phase, the Wortry is the desti-nation, and OGT 2.0 is the framework that combines them.
|
Component |
Original OGT [1] |
OGT 2.0 (this paper) |
|
Unit of analysis |
Corporation |
Country or bloc of countries |
|
Direction of growth |
Three phases of ecological thinking: egocentric, ethnocentric and worldcentric (Figure 2) |
The same three phases of ecological thinking |
|
Measure of progress within each phase |
Five levels of Maslow’s hierarchy of needs (Table 1) |
Five maturity levels of CMMI (Figure 5) |
|
Path |
Nine steps (Figure 3) |
Nine steps (Figure 4), scored on a 15-point scale (Table 3) |
|
End point |
Founcorp (Foundation Corporate) |
Wortry (World Country) |
Table 2: Relationship between the components of the original OGT and those of OGT 2.0
Capability Maturity Model Integration
CMMI is a process improvement model. In CMMI, a maturity level is a well-defined evolutionary plateau on the way to achieving a mature process [37]. The five levels are initial, managed, defined, quantitatively managed and op-timizing, as shown in Figure 5.
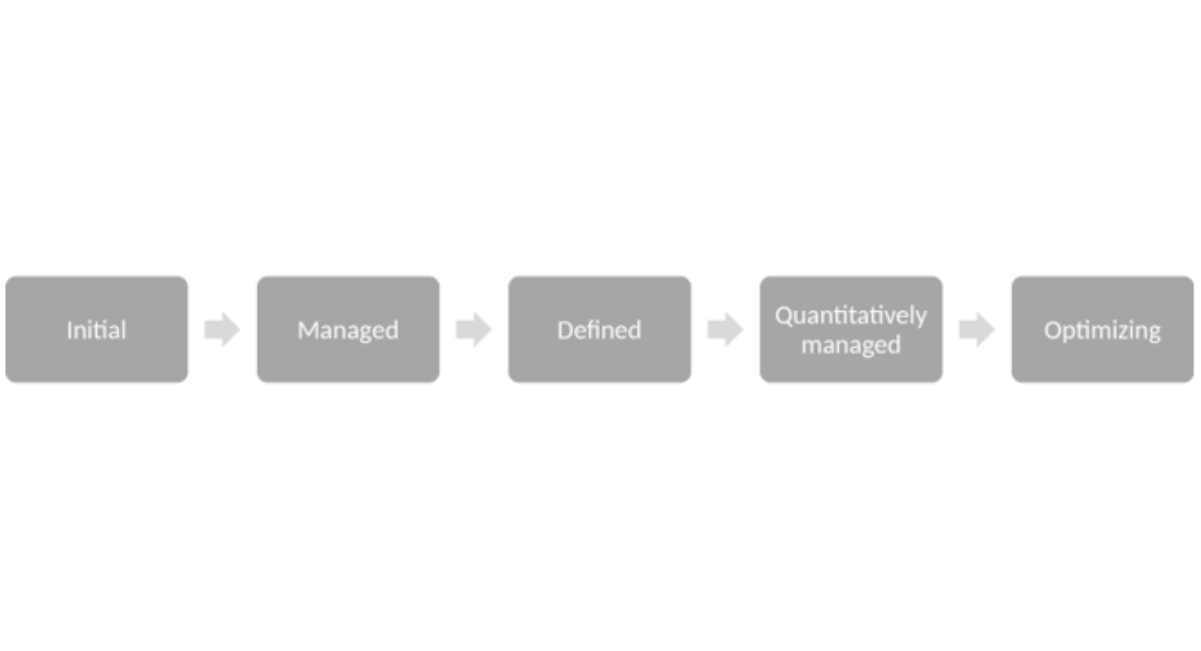
Figure 5: The five maturity levels of Capability Maturity Model Integration (CMMI).
In OGT 2.0, each country or bloc of power is in one of the three phases of ecological thinking (egocentric, ethno-centric or worldcentric) and, within that phase, at one of the five CMMI maturity levels. Combining the two gives the 15-point scale in Table 3: a score of 1 denotes an egocentric country at the initial maturity level, and a score of 15 denotes a worldcentric country at the optimizing maturity level. Scores of 1–5 therefore correspond to the egocentric phase, scores of 6–10 to the ethnocentric phase and scores of 11–15 to the worldcentric phase. A country becomes a Wortry once it has passed all five CMMI levels in the worldcentric phase (Figure 4).
|
Phase of ecological thinking |
Initial |
Managed |
Defined |
Quantitatively managed |
Optimizing |
|
Egocentric |
1 |
2 |
3 |
4 |
5 |
|
Ethnocentric |
6 |
7 |
8 |
9 |
10 |
|
Worldcentric |
11 |
12 |
13 |
14 |
15 |
Table 3: The OGT 2.0 scoring scale, which combines the three phases of ecological thinking with the five CMMI maturity levels.
Sustainable Development Goals
The SDGs are used to determine where a country stands on this scale. In this paper, they serve as the tool for in-vestigating how three major economic blocs (the US, the EU and China) have evolved towards, or moved away from, becoming a Wortry, and how COVID-19 has influenced this evolution [1]. For this purpose, the 17 goals are grouped into three dimensions, namely economy, society and environment [2,38], as shown in Figure 6. The economy dimension contains SDGs 8, 9, 10, 12 and 17; the society dimension contains SDGs 1–7, 11 and 16; and the environment dimension contains SDGs 13, 14 and 15.
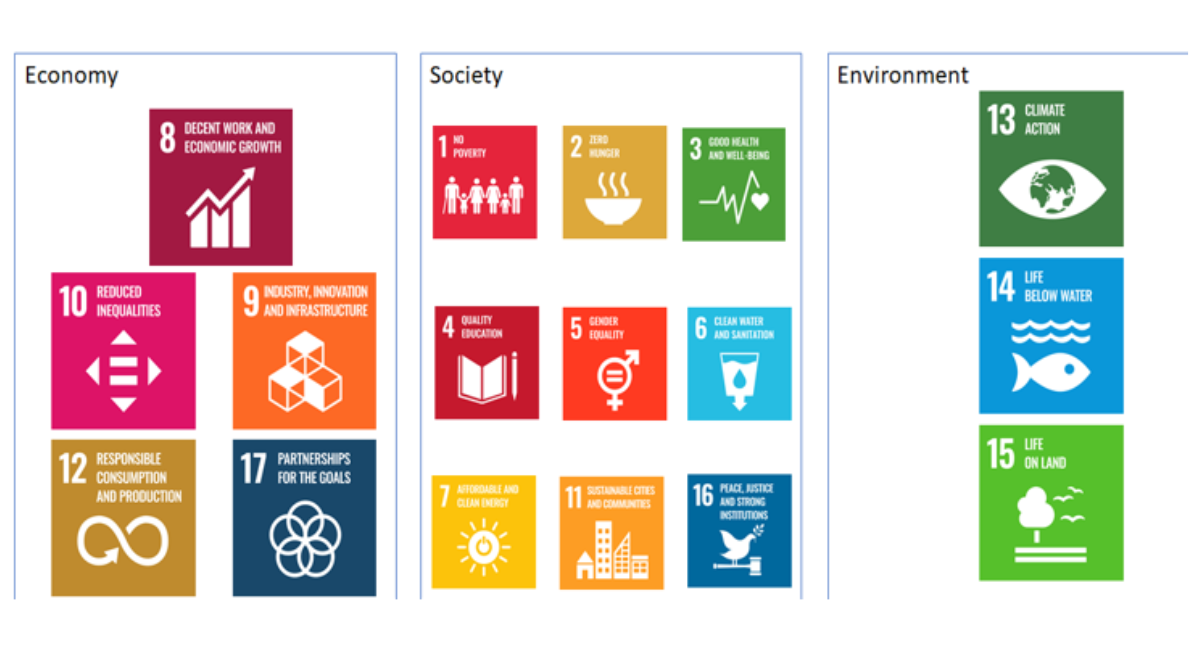
Figure 6: Grouping of the 17 Sustainable Development Goals into the economy, society and environment dimensions.
This grouping has been used in the modelling and analysis carried out for this research [39]. Each dimension is represented by one macro-level measure: gross domestic product (GDP) for the economy, the Human Development Index (HDI) for society and total carbon-equivalent emissions for the environment. Each bloc receives a score between 1 and 15 on each of the three dimensions.
COVID-19 as a Sensitivity Case
The COVID-19 pandemic is used to examine how sensitive the OGT scores are to a major global event. To frame this analysis, a PEST (political, economic, socio-cultural and technological) analysis of the effects of COVID-19 on societies was carried out. PEST is a framework of macro-environmental factors used in the environmental scanning component of strategic management. It gives an overview of the macro-environmental factors that have to be taken into consideration when studying the effect of an external factor, in this case the coronavirus pandemic, and it is a strategic tool for understanding growth or decline, current position, potential and direction. The analysis distinguishes three periods: a shock period, a re-thinking period and a change period. It is summarized in Figure 7, and many of the developments it anticipated have since materialized.
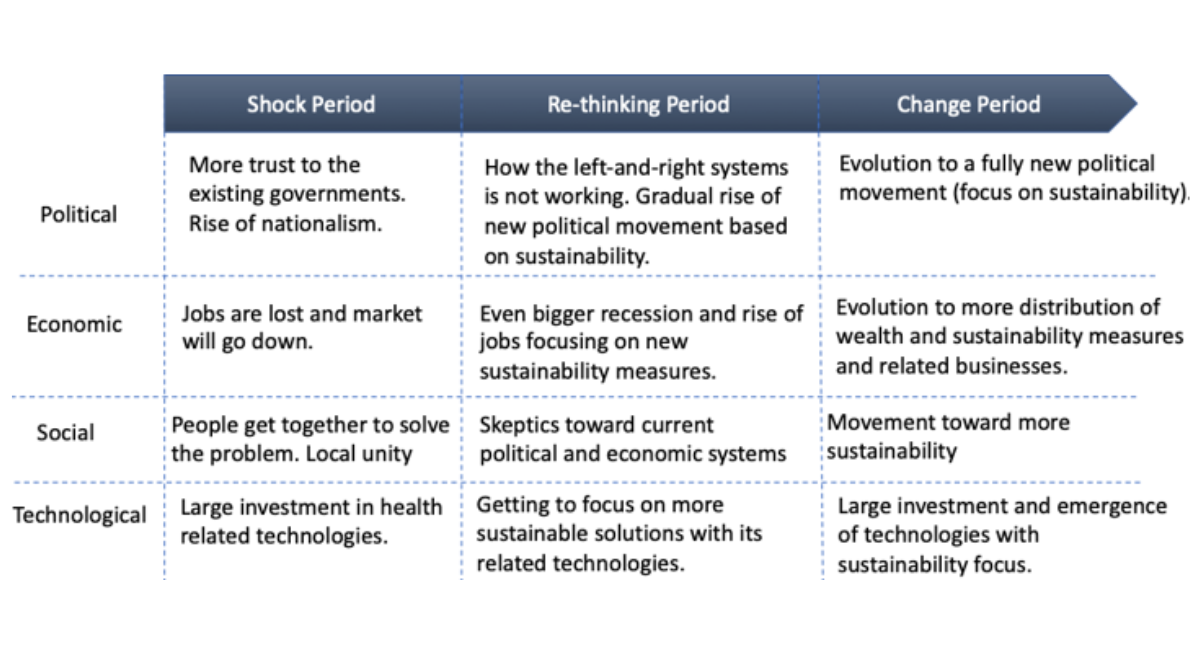
Figure 7: PEST analysis of the effects of COVID-19 on societies over the shock, re-thinking and change periods.
At the time of the analysis, the world was in the re-thinking period, in which many initiatives were moving to-wards sustainability. The sensitivity analysis in Section 6 should be read in this context: it compares the OGT scores of each bloc before the pandemic with its scores during the re-thinking period.
RESULTS
The Three Blocs of Power
The framework is applied to three major blocs of power: the US, the EU and China. Together, these three blocs account for about 60% of world GDP, and each has a GDP per capita of more than USD 10,000 (Table 4).
|
Bloc |
GDP in 2020 (billion USD) |
Share of world GDP (%) |
GDP per capita (USD) |
Population (millions) |
Change in GDP from 2019 (%) |
|
US |
20,936 |
25 |
63,534 |
320 |
−2.3 |
|
EU |
15,192 |
18 |
33,927 |
448 |
−2.8 |
|
China |
14,722 |
17 |
10,500 |
1,400 |
3.1 |
Table 4: The three blocs of power considered in this study.
As Table 4 shows, China is the only one of the three economies whose GDP increased during the first year of the pandemic (+3.1%), whereas the GDP of the US and that of the EU contracted by 2.3% and 2.8%, respectively.
OGT Scores and COVID-19 Sensitivity Analysis
The three dimensions defined in Section 5.3 were modelled with the macroeconomic measures for each bloc, and each bloc was scored on the 15-point scale of Table 3. A sensitivity analysis of the effects of COVID-19 was then per-formed with the model. Table 5 reports the scores before the pandemic (December 2019) and in August 2021, together with the pandemic sensitivity, which is the percentage change in the total score of a bloc between the two dates.
|
Bloc |
Before the pandemic (December 2019) |
Aug-21 |
Pandemic sensitivity (%) |
||||||
|
Economy |
Society |
Environment |
Total |
Economy |
Society |
Environment |
Total |
||
|
US |
12 |
11 |
10 |
33 |
11 |
9 |
10 |
30 |
−9.09 |
|
EU |
12 |
12 |
12 |
36 |
11 |
11 |
13 |
35 |
−2.78 |
|
China |
10 |
9 |
11 |
30 |
11 |
9 |
11 |
31 |
3.33 |
|
All three blocs |
34 |
32 |
33 |
99 |
33 |
29 |
34 |
96 |
−3.03 |
Table 5: OGT scores of the three blocs before the pandemic and in August 2021, and the resulting pandemic sensitivity.
Before the pandemic, the EU scored 12 on all three dimensions. The US was in the worldcentric band for economy (12) and society (11) and at the top of the ethnocentric band for environment (10). China was in the worldcentric band for environment (11) and in the ethnocentric band for economy (10) and society (9).
By August 2021, the US had lost one point on economy and two points on society, which moved its society score from the worldcentric band back to the ethnocentric band; its total score fell from 33 to 30 (−9.09%). The EU lost one point on economy and one on society but gained one on environment, so that its total score fell from 36 to 35 (−2.78%). China gained one point on economy, which moved this dimension into the worldcentric band, while its scores for society and environment were unchanged; its total score rose from 30 to 31 (+3.33%). China is therefore the only bloc whose OGT score increased and which moved closer to becoming a Wortry, whereas the scores of the US and the EU decreased. The combined score of the three blocs fell from 99 to 96, a reduction of 3.03%.
These results indicate that the pandemic paused the evolution of the three blocs towards becoming truly world-centric. The decline was concentrated in the economy and society dimensions; the environment score did not fall in any of the three blocs. The recovery plans of the three blocs, however, appear to be closely aligned with the OGT dimensions, and the scores were expected to improve markedly by the end of 2022.
CONCLUSION
This paper set out to show that Organic Growth Theory provides a forward-looking approach to global sustainable competitiveness. Its main conceptual contribution is OGT 2.0, which extends the theory from corporations to countries by combining two components in a single scale. The three phases of ecological thinking define the direction in which a country should grow, from egocentric through ethnocentric to worldcentric, and the five CMMI maturity levels measure how far the country has progressed within each phase. The end point of the resulting 15-point scale is the Wortry, a country that grows and creates jobs without compromising the ability of future generations to meet their needs. Linked to the SDGs through the dimensions of economy, society and environment, the framework does more than rank countries: it shows where each country stands on the path and what its next step is.
The application to the US, the EU and China shows that the framework responds to a global shock in a way that can be interpreted. Between December 2019 and August 2021, the combined OGT score of the three blocs fell by 3.03%. The scores of the US and the EU decreased by 9.09% and 2.78%, respectively, while that of China increased by 3.33%, and the losses occurred in the economy and society dimensions rather than in the environment dimension. The pan-demic thus paused the evolution of these blocs towards becoming truly worldcentric.
The framework has three practical implications. First, the OGT scores show policymakers on which dimension a country is furthest from the worldcentric phase and, therefore, where attention is most needed; for the US in this analysis, that dimension is society. Second, recovery plans and other major policy packages can be checked against the three dimensions, so that economic recovery is not achieved at the expense of society or the environment. Third, because all countries are placed on the same scale, the framework allows blocs to be compared with one another and their progress to be tracked over time.
The analysis also has limitations: each dimension is represented by a single aggregate measure, only three blocs are considered, and the scores are compared at two points in time. Future research will therefore address three directions. The scores can be updated with more recent data in order to verify whether the improvement expected from the recovery plans has materialized. The framework can be applied to further countries and regions. Finally, this research and Organic Growth Theory will be extended to the effects of other major events on global sustainable competitiveness, such as the war in Ukraine and the Israel–Palestine conflict, and to other sustainability challenges.
CONFLICT OF INTEREST
The author declares no conflicts of interest.
REFERENCES
- Karnama A, Vinuesa R. Organic growth theory for corporate sustainability. Sustainability. 2020;12(20):8523. [Crossref] [Google Scholar]
- Tracey P, Phillips N, Haugh H. Beyond philanthropy: Community enterprise as a basis for corporate citizenship. J Bus Ethics. 2005;58:327-344. [Crossref] [Google Scholar]
- Davies IA, Haugh H, Chambers L. Barriers to social enterprise growth. J Small Bus Manag. 2019;57(4):1616-1636. [Crossref] [Google Scholar]
- Costanza R, Fioramonti L, Kubiszewski I. Sustainable development goals: A need for relevant indicators. Ecol Indic. 2016;60:565-573. [Crossref] [Google Scholar]
- Zhang N, Kong F, Choi Y. Measuring sustainability performance for China: A sequential generalized directional distance function approach. Econ Model. 2014;41:392-397. [Crossref] [Google Scholar]
- Soppe A. Sustainable corporate finance. J Bus Ethics. 2004;53(1-2):213-224. [Crossref] [Google Scholar]
- Singh RK, Luthra S, Mangla SK, Uniyal S. Applications of information and communication technology for sustainable growth of SMEs in India food industry. Resour Conserv Recycl. 2019;147:10-18. [Crossref] [Google Scholar]
- Shrivastava P, Hart S. Creating sustainable corporations. Bus Strategy Environ. 1995;4(3):154-165. [Crossref] [Google Scholar]
- Antanasijević D, Pocajt V, Ristić M, Perić-Grujić A. A differential multi-criteria analysis for the assessment of sustainability performance of European countries: Beyond country ranking. J Clean Prod. 2017;165:213-220. [Crossref] [Google Scholar]
- Tan Y, Shuai C, Jiao L, Shen L. An adaptive neuro-fuzzy inference system (ANFIS) approach for measuring country sustainability performance. Environ Impact Assess Rev. 2017;65:29-40. [Crossref] [Google Scholar]
- A. Karnama. Organic Growth Theory. LinkedIn. 2019.
- Aras G, Crowther D. Governance and sustainability: An investigation into the relationship between corporate governance and corporate sustainability. Manag Decis. 2008;46(3):433-448. [Crossref] [Google Scholar]
- Lee YK. The relationship between green country image, green trust, and purchase intention of Korean products: Focusing on Vietnamese Gen Z consumers. Sustainability. 2020;12(12):5098. [Crossref] [Google Scholar]
- Böhringer C, Jochem PEP. Measuring the immeasurable—A survey of sustainability indices. Ecol Econ. 2007;63(1):1-8. [Crossref] [Google Scholar]
- Visser W, Tolhurst N, editors. The world guide to CSR: A country-by-country analysis of corporate sustainability and responsibility. London: Routledge; 2010. [Crossref] [Google Scholar]
- Cucchiella F, D'Adamo I, Gastaldi M, Koh SCL, Rosa P. A comparison of environmental and energetic performance of European countries: A sustainability index. Renew Sustain Energy Rev. 2017;78:401-413. [Crossref] [Google Scholar]
- Bell S, Morse S. Sustainability indicators: Measuring the immeasurable?. 2nd ed. London: Routledge; 2012. [Crossref] [Google Scholar]
- Moldan B, Janoušková S, Hák T. How to understand and measure environmental sustainability: Indicators and targets. Ecol Indic. 2012;17:4-13. [Crossref] [Google Scholar]
- Corrente S, Greco S, Leonardi F, Słowiński R. The hierarchical SMAA-PROMETHEE method applied to assess the sustainability of European cities. Appl Intell. 2021;51(9):6430-6448. [Crossref] [Google Scholar]
- Papathanasiou J, Ploskas N. Multiple criteria decision aid: Methods, examples and Python implementations. Cham: Springer; 2018. [Crossref]
- Wang JJ, Jing YY, Zhang CF, Zhao JH. Review on multi-criteria decision analysis aid in sustainable energy decision-making. Renew Sustain Energy Rev. 2009;13(9):2263-2278. [Crossref] [Google Scholar]
- Arbolino R, Boffardi R, Ioppolo G, Lantz TL, Rosa P. Evaluating industrial sustainability in OECD countries: A cross-country comparison. J Clean Prod. 2022;331:129773. [Crossref] [Google Scholar]
- Diaz-Sarachaga JM, Jato-Espino D, Castro-Fresno D. Is the Sustainable Development Goals (SDG) index an adequate framework to measure the progress of the 2030 Agenda?. Sustain Dev. 2018;26(6):663-671. [Crossref] [Google Scholar]
- Talberth J, Cobb C, Slattery N. The Genuine Progress Indicator 2006: A tool for sustainable development. Oakland (CA): Redefining Progress; 2007. [Crossref] [Google Scholar]
- Dutta S, Lanvin B, Wunsch-Vincent S, editors. Global Innovation Index 2017: Innovation feeding the world. Ithaca (NY): Cornell University; 2017. [Crossref] [Google Scholar]
- Hsu A, Zomer A. Environmental Performance Index. Wiley StatsRef: Statistics Reference Online. 2014. [Crossref] [Google Scholar]
- Van de Kerk G, Manuel AR. A comprehensive index for a sustainable society: The SSI—The Sustainable Society Index. Ecol Econ. 2008;66(2-3):228-242. [Crossref] [Google Scholar]
- Legatum Institute. The Legatum Prosperity Index 2014. London: Legatum Institute; 2014. [Crossref] [Google Scholar]
- Candan G, Toklu MC. Sustainable industrialization performance evaluation of European Union countries: An integrated spherical fuzzy analytic hierarchy process and grey relational analysis approach. Int J Sustain Dev World Ecol. 2022;29(5):387-400. [Crossref] [Google Scholar]
- Ligus M, Peternek P. The sustainable energy development index—an application for european union member states. Energies. 2021;14(4):1117. [Crossref] [Google Scholar]
- Karnama A, Peças Lopes JA, Augusto da Rosa M. Impacts of Low-Carbon Fuel Standards in transportation on the electricity market. Energies. 2018;11(8):1943. [Crossref] [Google Scholar]
- Karnama A, Haghighi EB, Vinuesa R. Organic data centers: A sustainable solution for computing facilities. Results Eng. 2019;4:100063. [Crossref] [Google Scholar]
- Karnama A. ENERGY X.0: Future of energy systems. Results Eng. 2019;3:100029. [Crossref] [Google Scholar]
- Perujo A, Ciuffo B. The introduction of electric vehicles in the private fleet: Potential impact on the electric supply system and on the environment. A case study for the Province of Milan, Italy. Energy Policy. 2010;38(8):4549-4561. [Crossref] [Google Scholar]
- Mignon IJ, Winberg L. The role of public energy advising in sustainability transitions—empirical evidence from Sweden. Energy Policy. 2023;177:113525. [Crossref] [Google Scholar]
- de Lange DE, Busch T, Delgado-Ceballos J. Sustaining sustainability in organizations. J Bus Ethics. 2012;110(2):151-156. [Crossref] [Google Scholar]
- Torrecilla-Salinas CJ, Sedeño J, Escalona MJ, Mejías M. Agile, Web Engineering and Capability Maturity Model Integration: A systematic literature review. Inf Softw Technol. 2016;71:92-107. [Crossref] [Google Scholar]
- Hirst P. The global economy—myths and realities. Int Aff. 1997;73(3):409-425. [Crossref] [Google Scholar]
- Vinuesa R, Azizpour H, Leite I, Balaam M, Dignum V, Domisch S, et al. The role of artificial intelligence in achieving the Sustainable Development Goals. Nat Commun. 2020;11(1):233. [Crossref] [Google Scholar] [PubMed]